> ##### 7. 그래프유형(type) 지정 #####
> x <- 1:10
> y <- 1:10
> opar <- par(mfrow=c(2,4))
> plot(x, y, type = "p", main="type=p") # point
> plot(x, y, type = "l", main="type=l") # line
> plot(x, y, type = "b", main="type=b") # both (point + line)
> plot(x, y, type = "o", main="type=o") # line이 point를 관통 (overplotted)
> plot(x, y, type = "c", main="type=c") # cancel (both - point)
> plot(x, y, type = "s", main="type=s") # step ft. (stair steps)
> plot(x, y, type = "S", main="type=S") # Step ft. (upper stair steps)
> plot(x, y, type = "h", main="type=h") # 막대그림 (histogram)
> par(opar)

> ##### 8. R에서 색상(col) #####
> # 빛 색상 '#FFFFFF' = White
> plot(dist ~ speed, xlab ="Speed (mph)", ylab ="Stopping distance (ft)",
+ col="#FFFFFF", cars)

> # col="6" = Pink
> plot(dist ~ speed, xlab ="Speed (mph)", ylab ="Stopping distance (ft)",
+ col=6, cars)

> # col = 'green'
> plot(dist ~ speed, xlab ="Speed (mph)", ylab ="Stopping distance (ft)",
+ col="green", cars)

> # rgb(0,0,1) = rgb(min, min, max) = Blue
> plot(dist ~ speed, xlab ="Speed (mph)", ylab ="Stopping distance (ft)",
+ col=rgb(0, 0, 1), cars)

> # 제목색깔 Red, 부제색깔 Blue, 라벨색깔 Green (라벨크기 1)
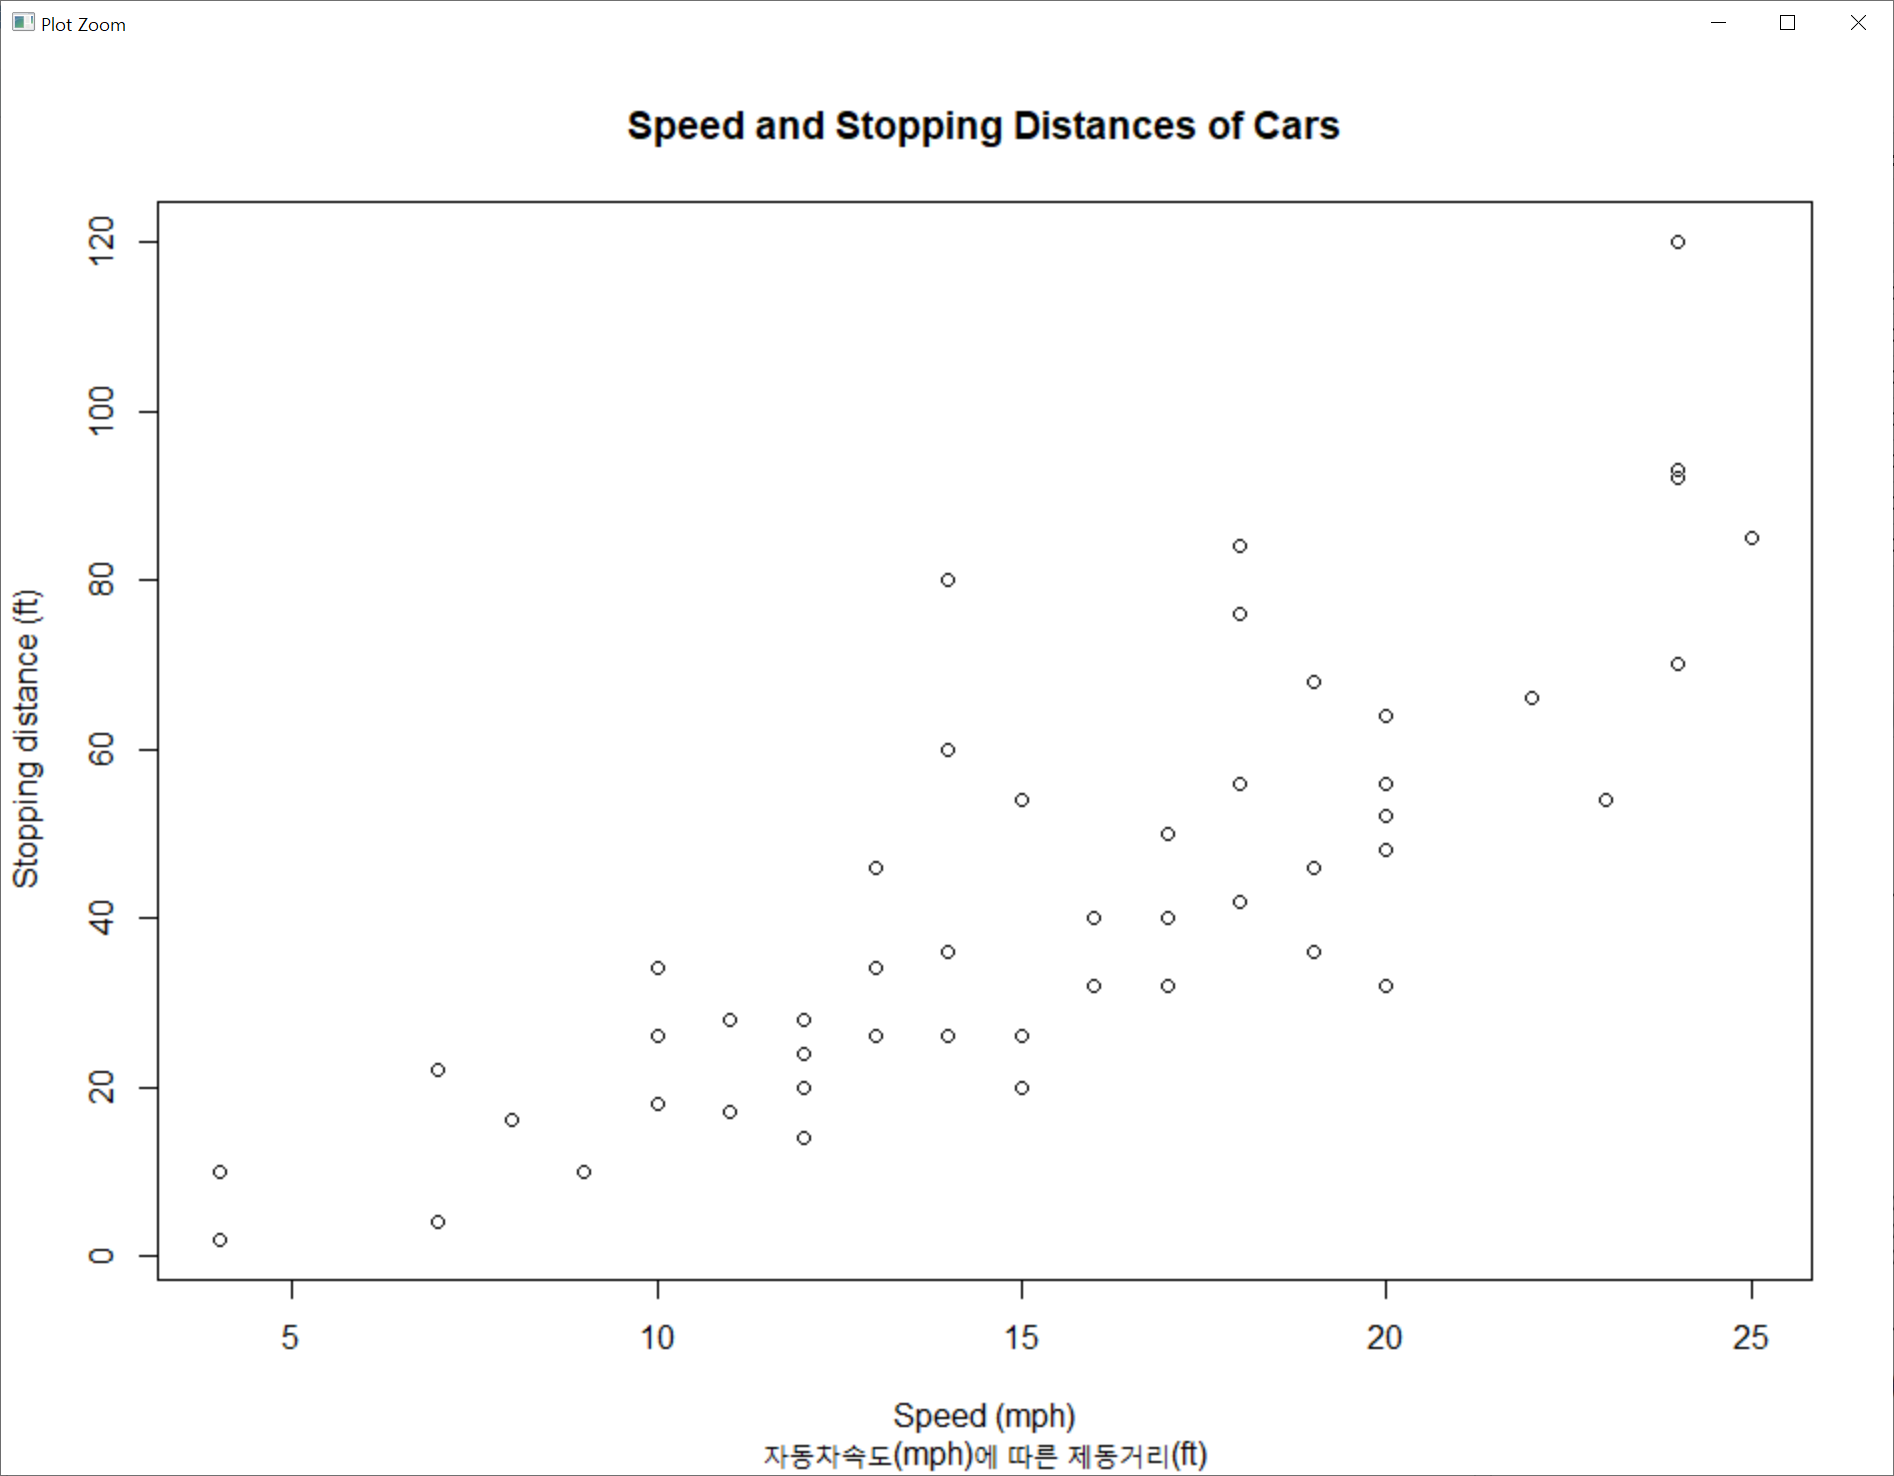
> plot(dist ~ speed, main ="Speed and Stopping Distances of Cars",
+ sub="자동차속도(mph)에 따른 제동거리(ft)",
+ xlab="Speed (mph)", ylab="Stopping distance (ft)",
+ col.main="red", col.sub="blue",
+ col.lab="green", cex.lab=1, cars)

> ##### 9. 낮은 수준의 그래프함수 #####
> # 낮은 수준의 그래프함수를 이용한 plot()함수
> plot(dist ~ speed, main ="Speed and Stopping Distances of Cars", sub="자동차속도(mph)에 따른 제동거리(ft)",
+ xlab ="Speed (mph)", ylab ="Stopping distance (ft)", cex.lab=1, cars)
> plot(dist ~ speed, ann=FALSE, cars, main ="Speed and Stopping Distances of Cars") # ann=FALSE : 제목과 라벨 없음
> title(main ="Speed and Stopping Distances of Cars", sub="자동차속도(mph)에 따른 제동거리(ft)",
+ xlab ="Speed (mph)", ylab ="Stopping distance (ft)", cex.lab=1, cars )

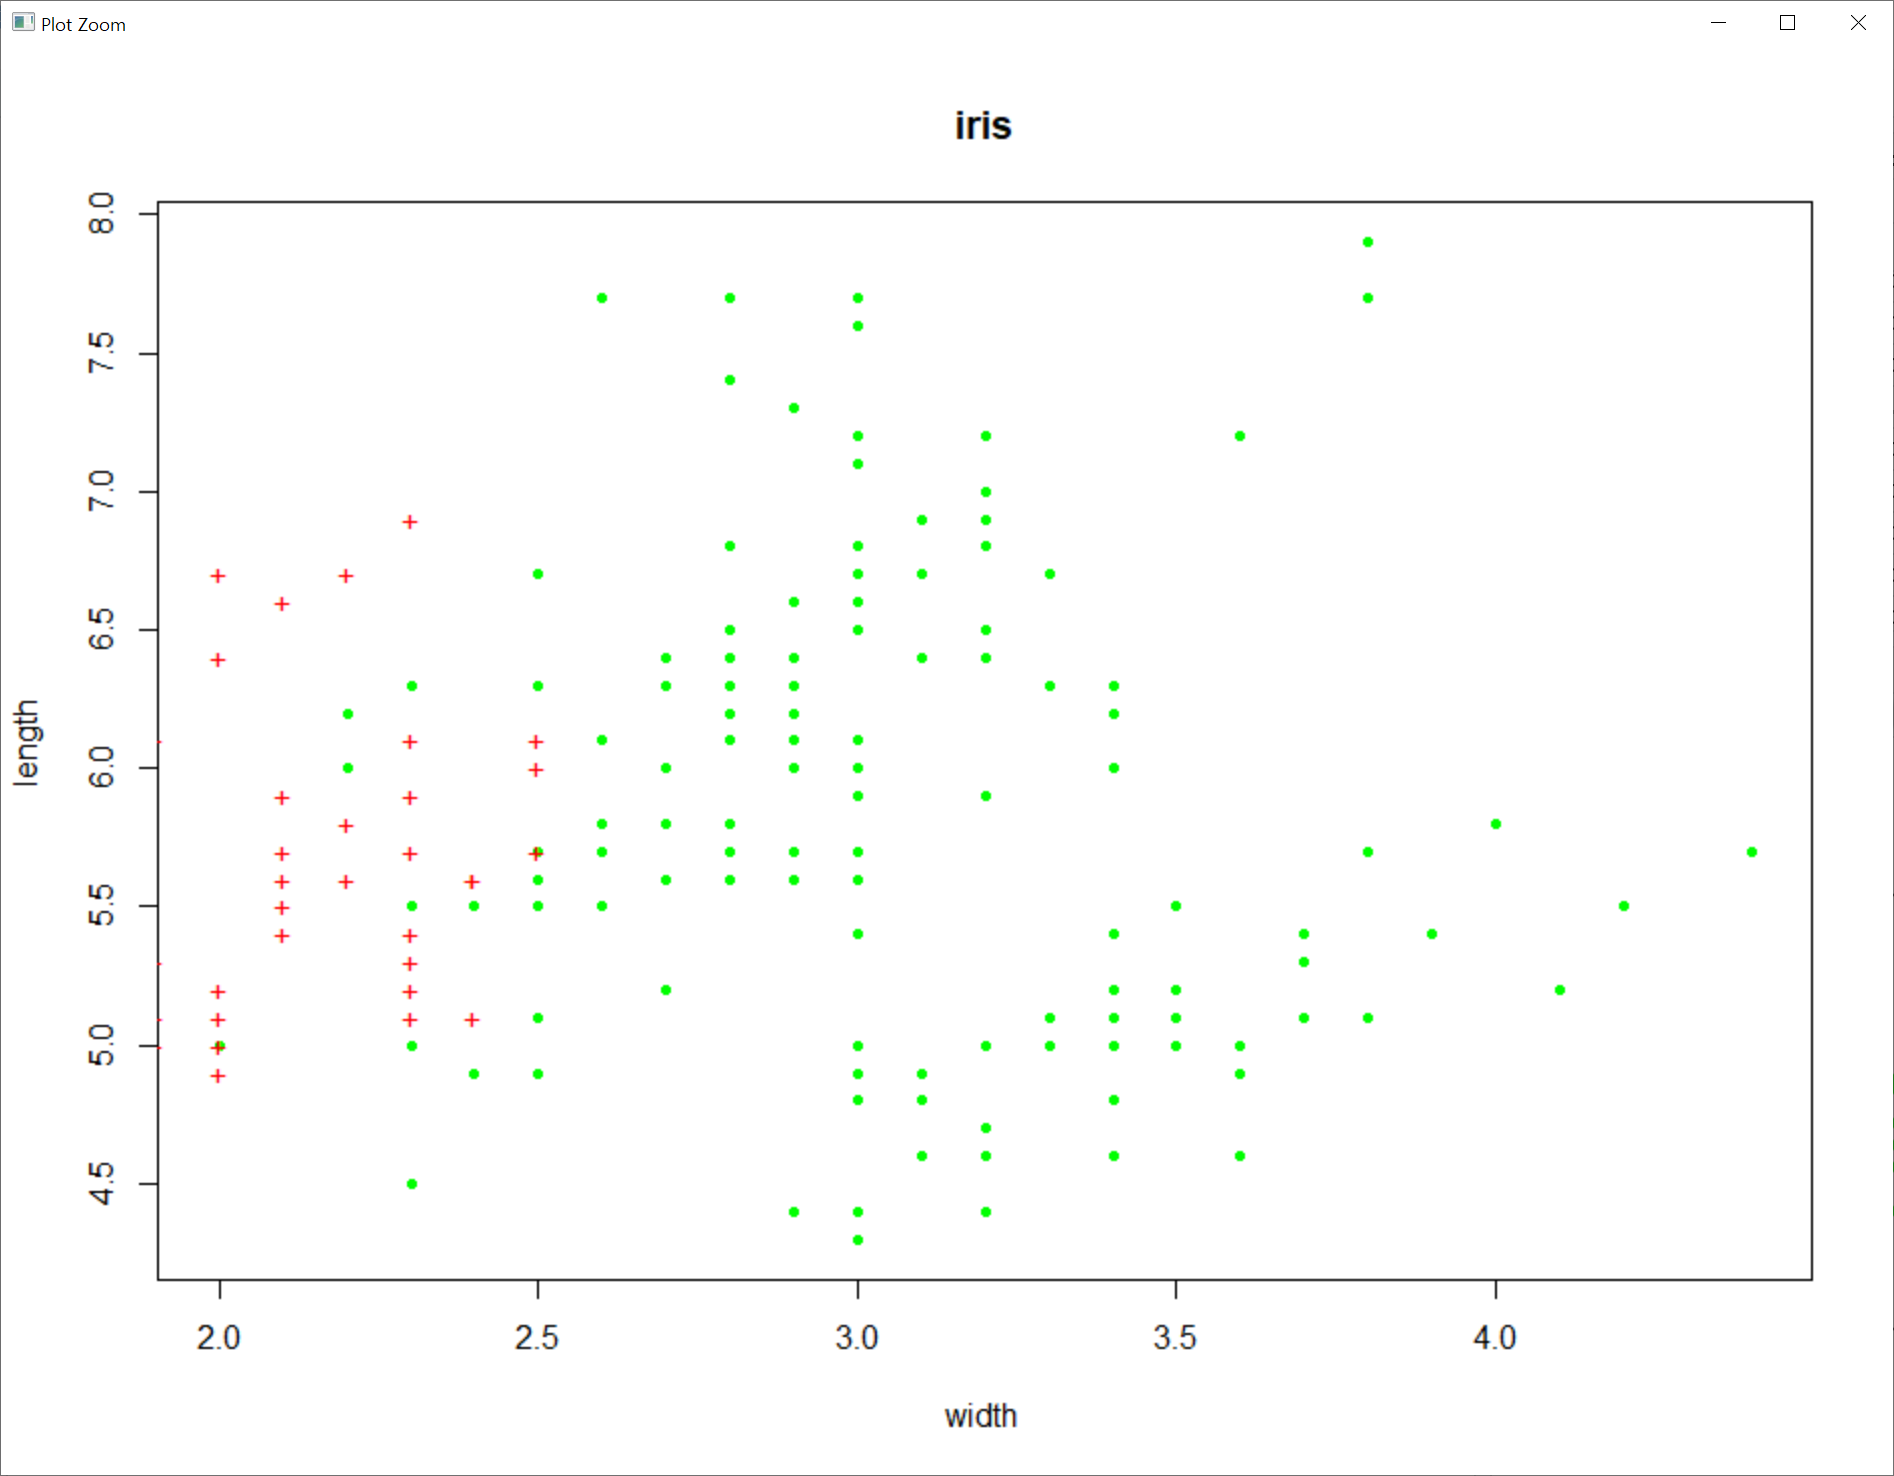
> # 점(points)
> plot(iris$Sepal.Width, iris$Sepal.Length, pch=20,
+ xlab ="width ", ylab ="length ", main ="iris", col ="green")
> points(iris$Petal.Width, iris$Petal.Length, pch ="+", col ="red")

> with(iris, {
+
+ plot(Sepal.Width, Sepal.Length, pch=20, xlab ="width", ylab ="length", main ="iris", col ="green")
+ points(Petal.Width, Petal.Length, pch ="+", col ="red")
+
+ })
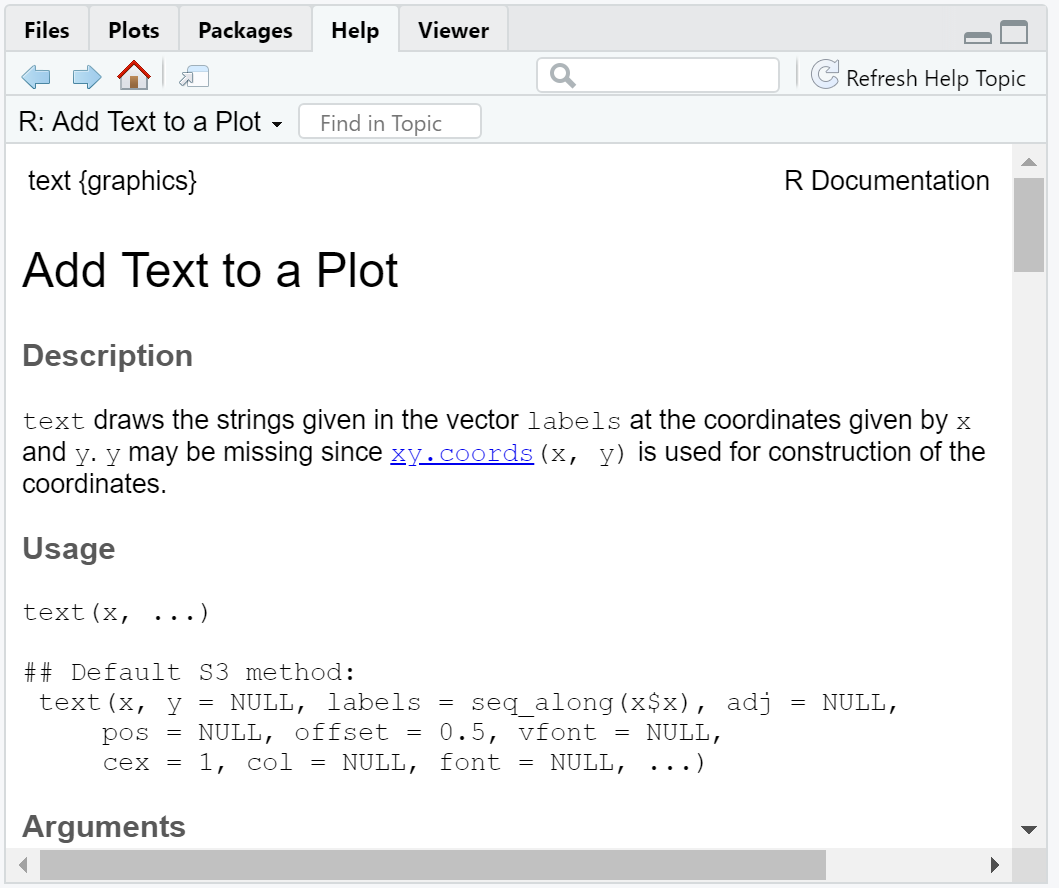
> # text(x, y, "문자추가", pos, ...) : 플랏영역에 문자를 추가할 때 사용
> # mtext("문자추가", side, line=n, ...) : 내부영역(마진) 또는 외부영역(바깥마진)에 문자를 추가할 때 사용
> plot(1:5, 1:5, col="red")
> text(3, 3, "R", pos=1)
> text(3, 3, "을", pos=2)
> text(3, 3, "짱", pos=3)
> text(3, 3, "좋아해", pos=4)

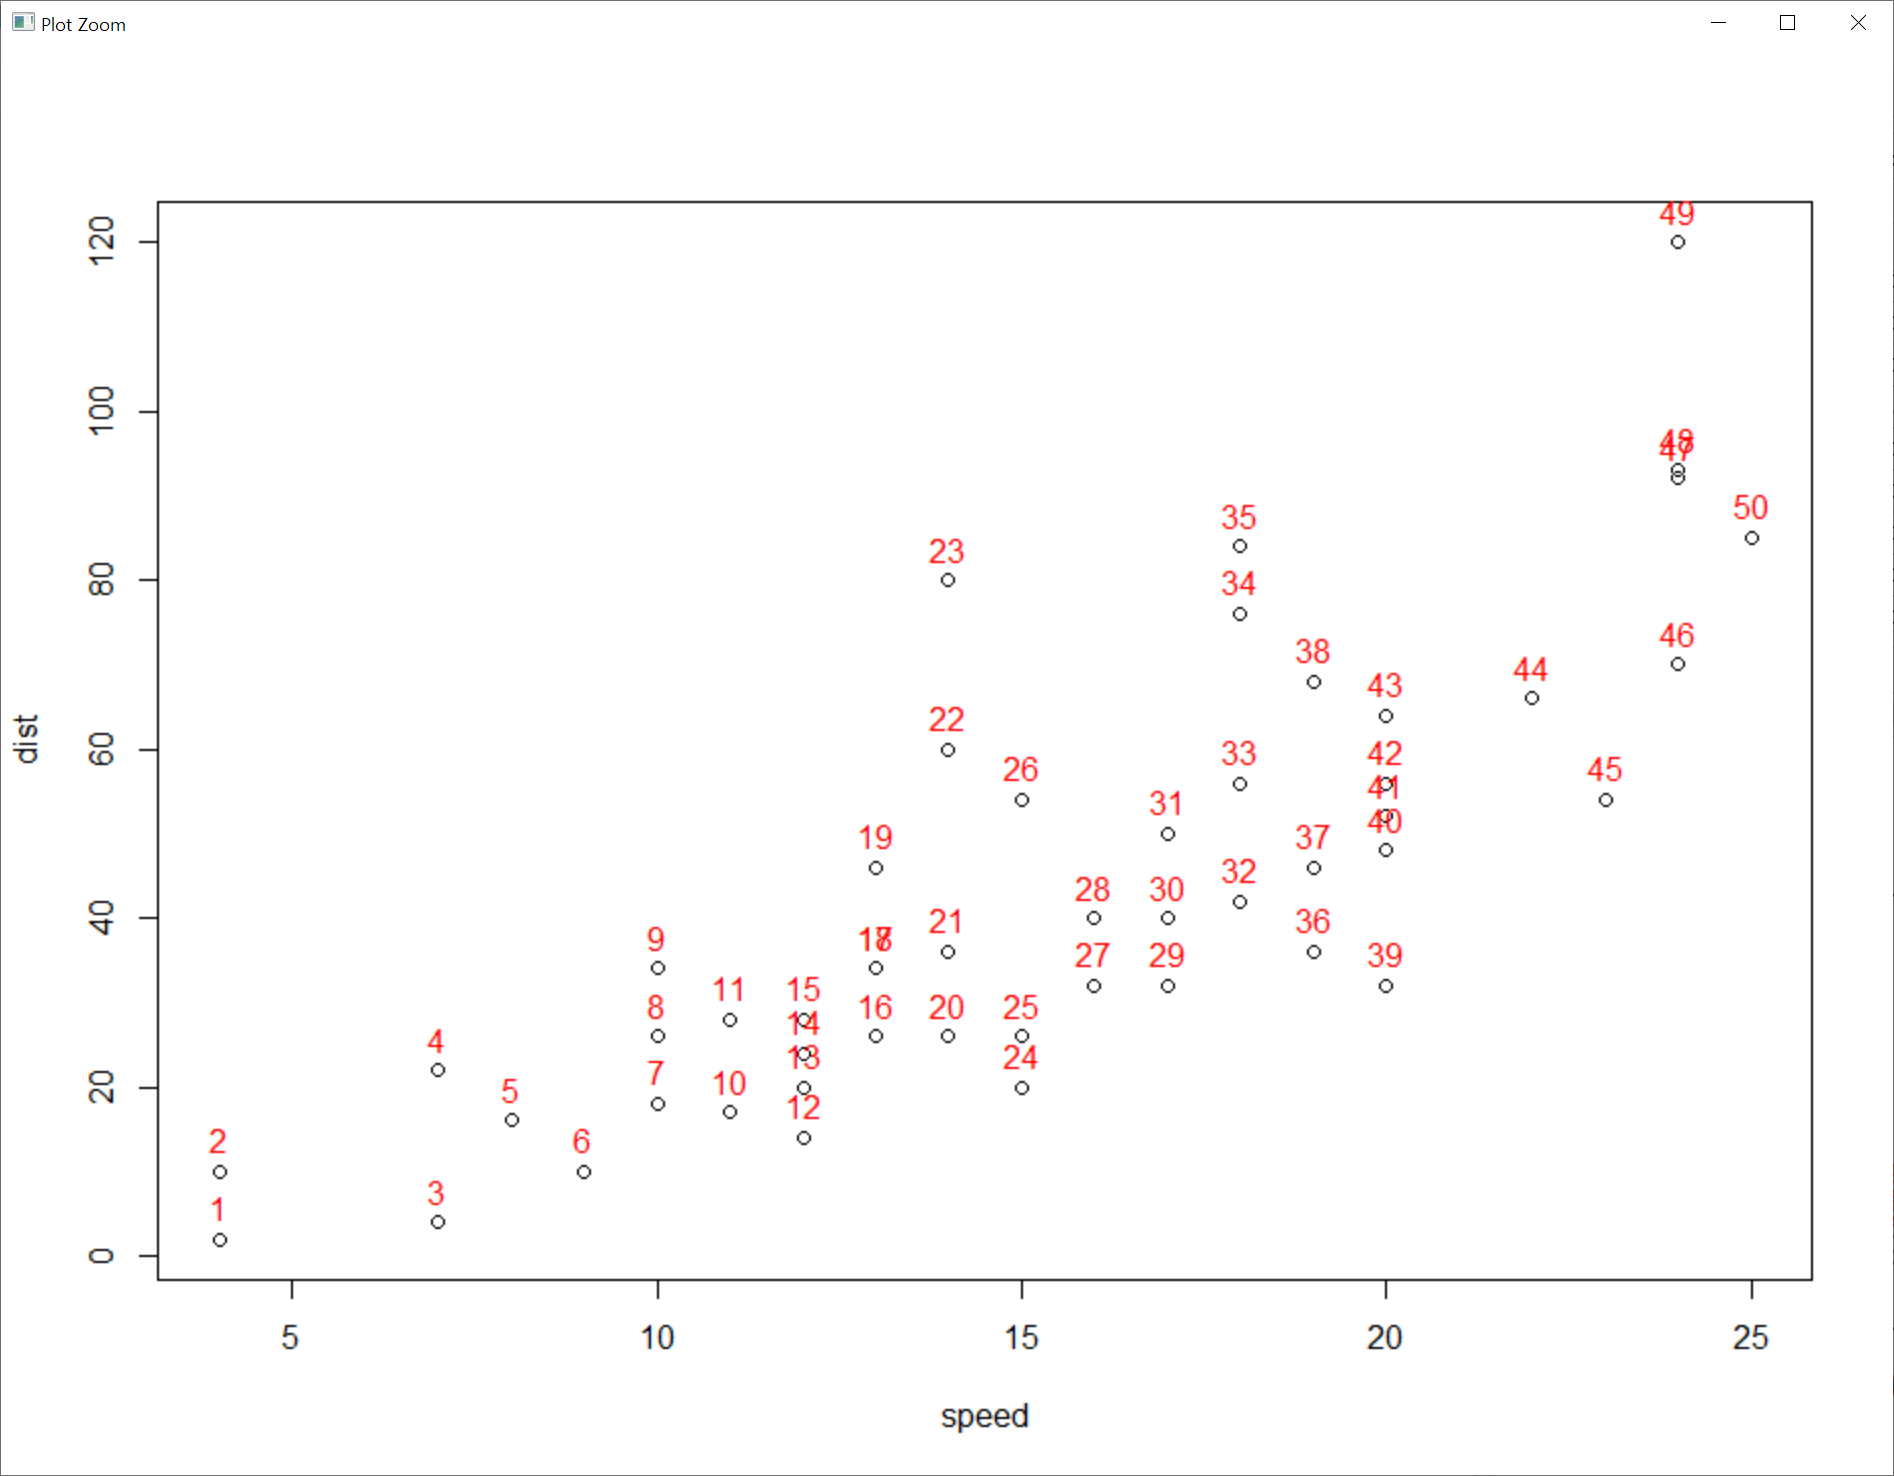
> plot(cars)
> text(cars$speed, cars$dist, labels=rownames(cars), pos=3, col="red")
> ?text
'데이터 [Data] > R' 카테고리의 다른 글
| R Distributions: 이항분포 (0) | 2021.06.04 |
|---|---|
| R Graphics 3: 문자나 점의 크기, 그래픽모수, 플랏영역, 좌표축범위 (0) | 2021.06.03 |
| R Graphics 1: plot(), attach(), with() 함수, 제목, 축 이름, 점(pch) (0) | 2021.06.01 |
| R apply 함수군: apply(), lapply(), sapply(), tapply(), mapply() (0) | 2021.05.01 |
| R 제어문: 조건문, 반복문 (0) | 2021.04.30 |


댓글