[R Graphics]
##### 1. cars 데이터 세트 #####
# plot을 출력하는 그래픽 장치는 여러 가지 그래픽 인수(graphical parameters)를 갖고있다.
# 그래픽 인수는 그래픽 속성을 정의한 값으로,
# 화면의 분할 방법, 그림 영역의 크기와 위치, 플랏 영역을 둘러싼 상자의 모양, 마진,
# 좌표 영역에 데이터가 표시되는 형태, 선의 종류, 문자나 글자의 크기 및 색상 등의 설정값이다.
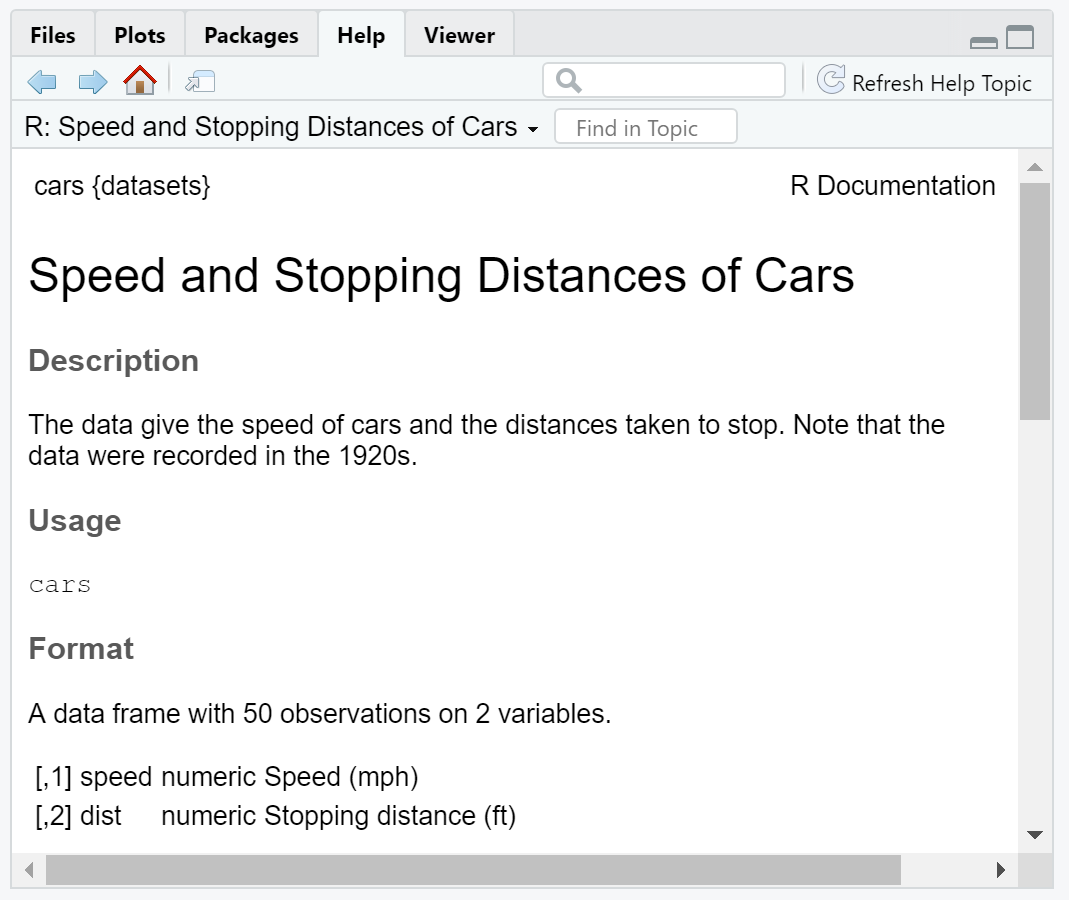
> head(cars) # 자동차 속도(mph)에 따른 제동거리(ft)를 측정한 데이터 세트
speed dist
1 4 2
2 4 10
3 7 4
4 7 22
5 8 16
6 9 10
> ?cars # cars에 대한 가이드
> help(cars) # 위와 동일
> ##### 2. 산점도함수 plot() #####
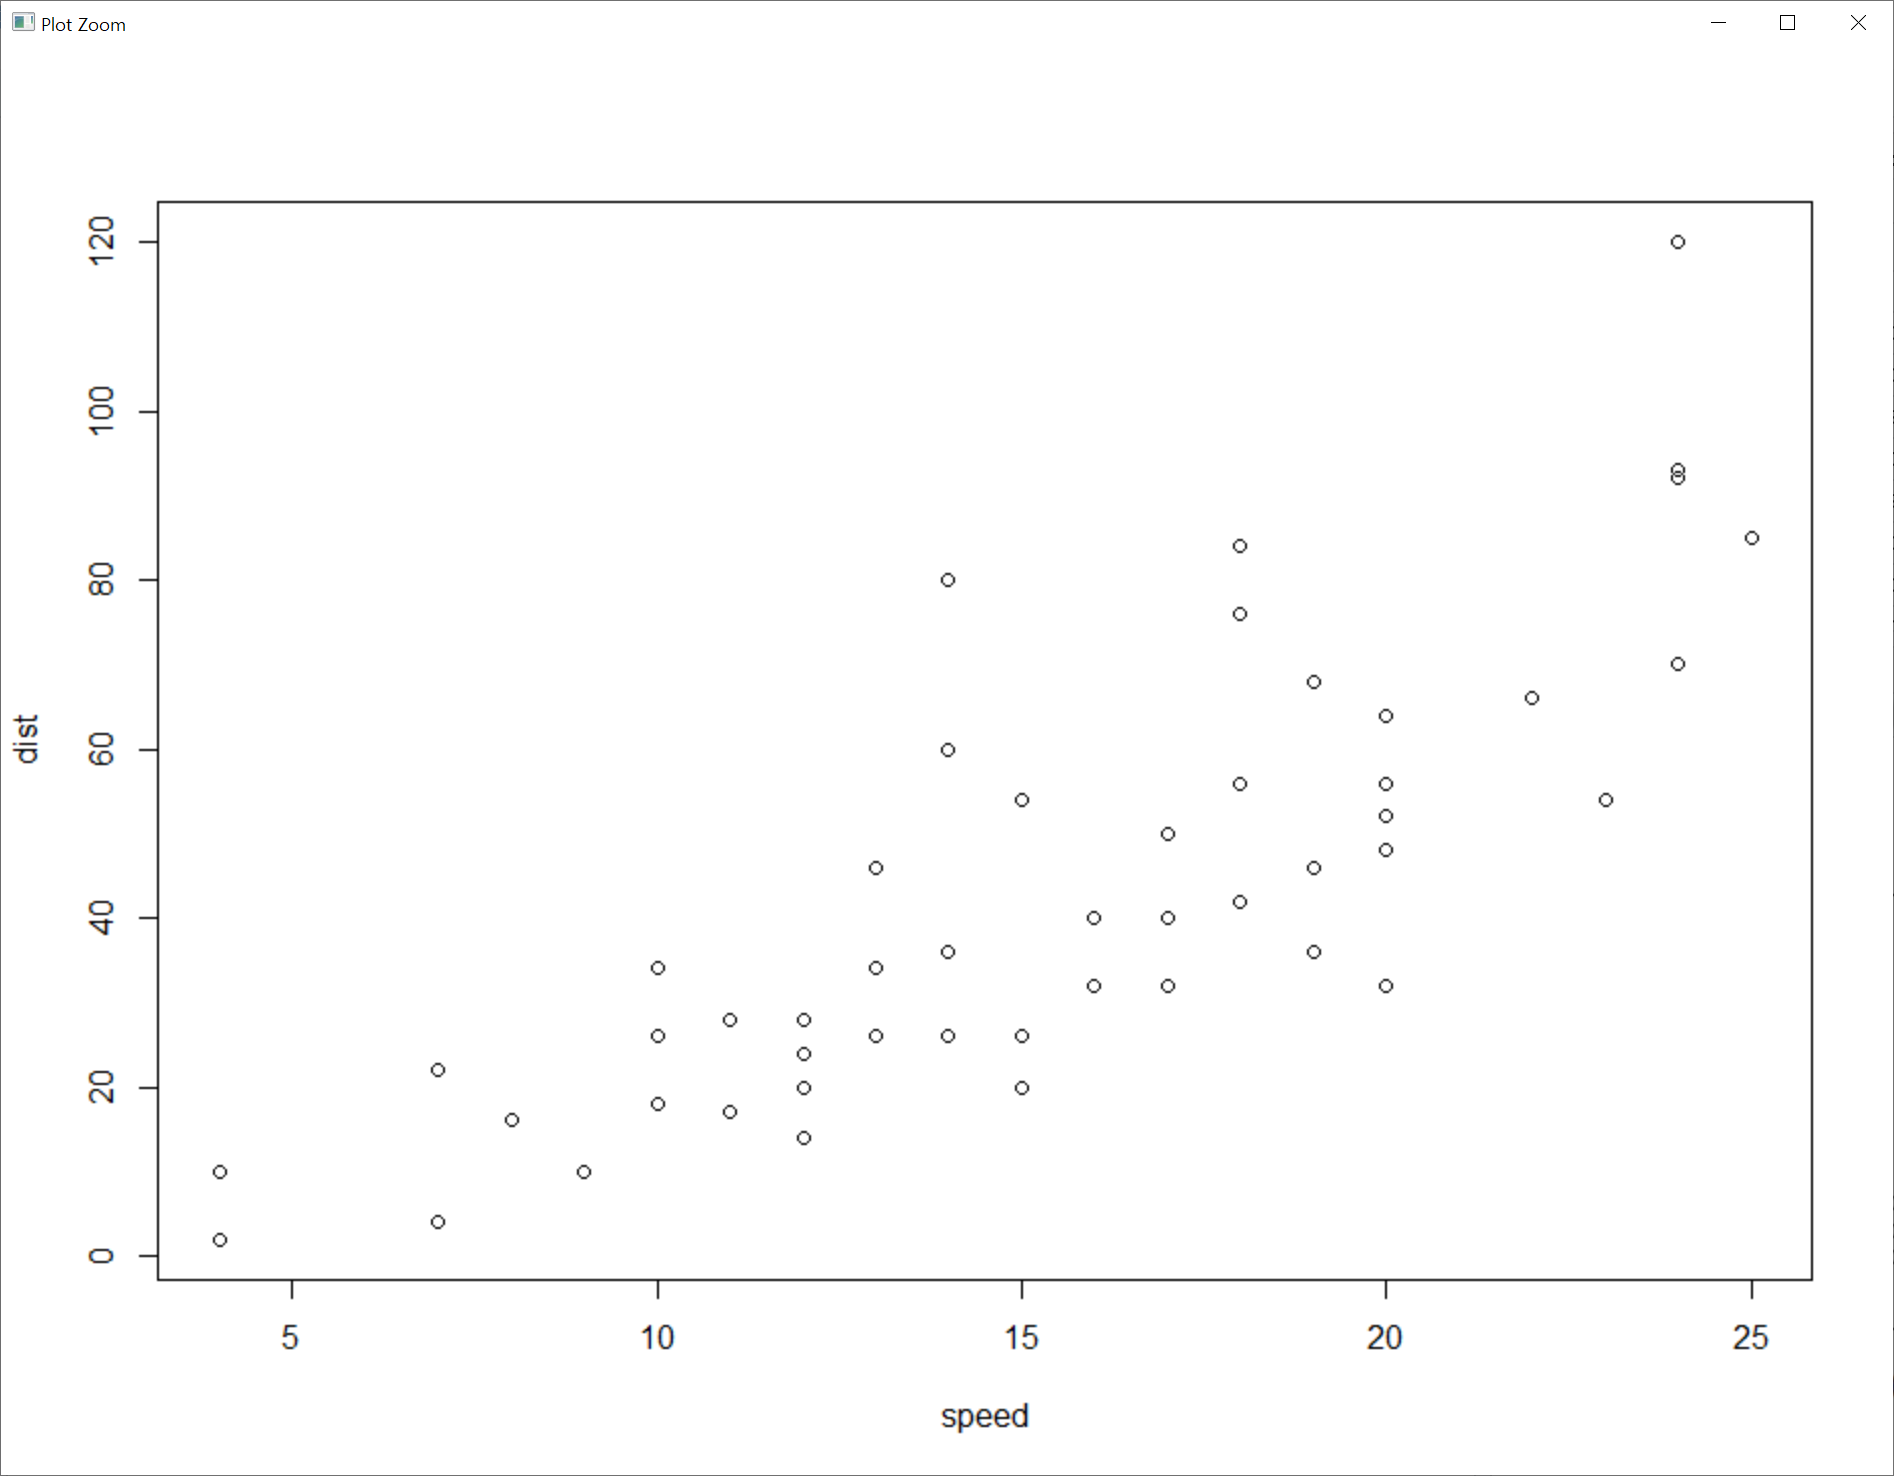
> plot(cars) # cars에 대한 산점도
> plot(dist ~ speed, cars) # y ~ x라는 formula (종속변수 ~ 독립변수)
> plot(speed, dist) # Error: speed는 cars의 변수이므로 speed로는 인식 불가
Error in plot(speed, dist) : 객체 'speed'를 찾을 수 없습니다
> plot(cars$speed, cars$dist) # cars 데이터 프레임의 변수 speed와 dist = '$' 기호 사용

##### 3. attach()함수와 with()함수 #####
> attach(cars) # attach 함수를 이용하여 speed와 dist 변수를 데이터 프레임으로 붙임
The following objects are masked from cars (pos = 3):
dist, speed
> plot(speed, dist) # 변수 이름만으로 산점도 생성
> detach(cars) # 원상복구 - speed와 dist를 다시 변수로 옮김(데이터 프레임에서 떼어냄)
> # 주의사항: 변수명과 동일한 이름의 데이터 프레임이 있을 경우
> # 두 데이터 프레임이 충돌하여 에러가 발생하게 됨 (attach 함수 사용 권장하지 않음)
> with(cars,
+ plot(speed, dist) # with() 함수를 이용하여 변수 이름만으로 데이터에 접근
+ )
> ##### 4. 그래프 제목(main) #####
> # main: 주제목, sub: 부제목, cex.lab: 축제목 크기
> plot(dist ~ speed, main ="Speed and Stopping Distances of Cars", sub="자동차속도(mph)에 따른 제동거리(ft)",
+ xlab ="Speed (mph)", ylab ="Stopping distance (ft)", cex.lab=1, cars)

> ##### 5. 축 이름(xlab, ylab) - x_label, y_label #####
> # par() 함수에서는 지원되지 않는 인수로 높은수준 그래픽함수에서 사용된다.
> plot(dist ~ speed, xlab ="Speed(mph)", ylab ="Stopping distance(ft)", cars)

> ##### 6. 점의 종류(pch) - point character #####
> # pch=0 : 빈 네모
> plot(dist ~ speed, xlab ="Speed (mph)", ylab ="Stopping distance (ft)",
+ pch=0, cars)

> # pch=1 : 빈 동그라미
> plot(dist ~ speed, xlab ="Speed (mph)", ylab ="Stopping distance (ft)",
+ pch=1, cars)

> # pch=3 : 플러스 기호, '+'와 차이 있음
> plot(dist ~ speed, xlab ="Speed (mph)", ylab ="Stopping distance (ft)",
+ pch=3, cars)
> plot(dist ~ speed, xlab ="Speed (mph)", ylab ="Stopping distance (ft)",
+ pch="+", cars)


> # pch=8 : 눈송이 기호, '*'와 차이 있음
> plot(dist ~ speed, xlab ="Speed (mph)", ylab ="Stopping distance (ft)",
+ pch=8, cars)
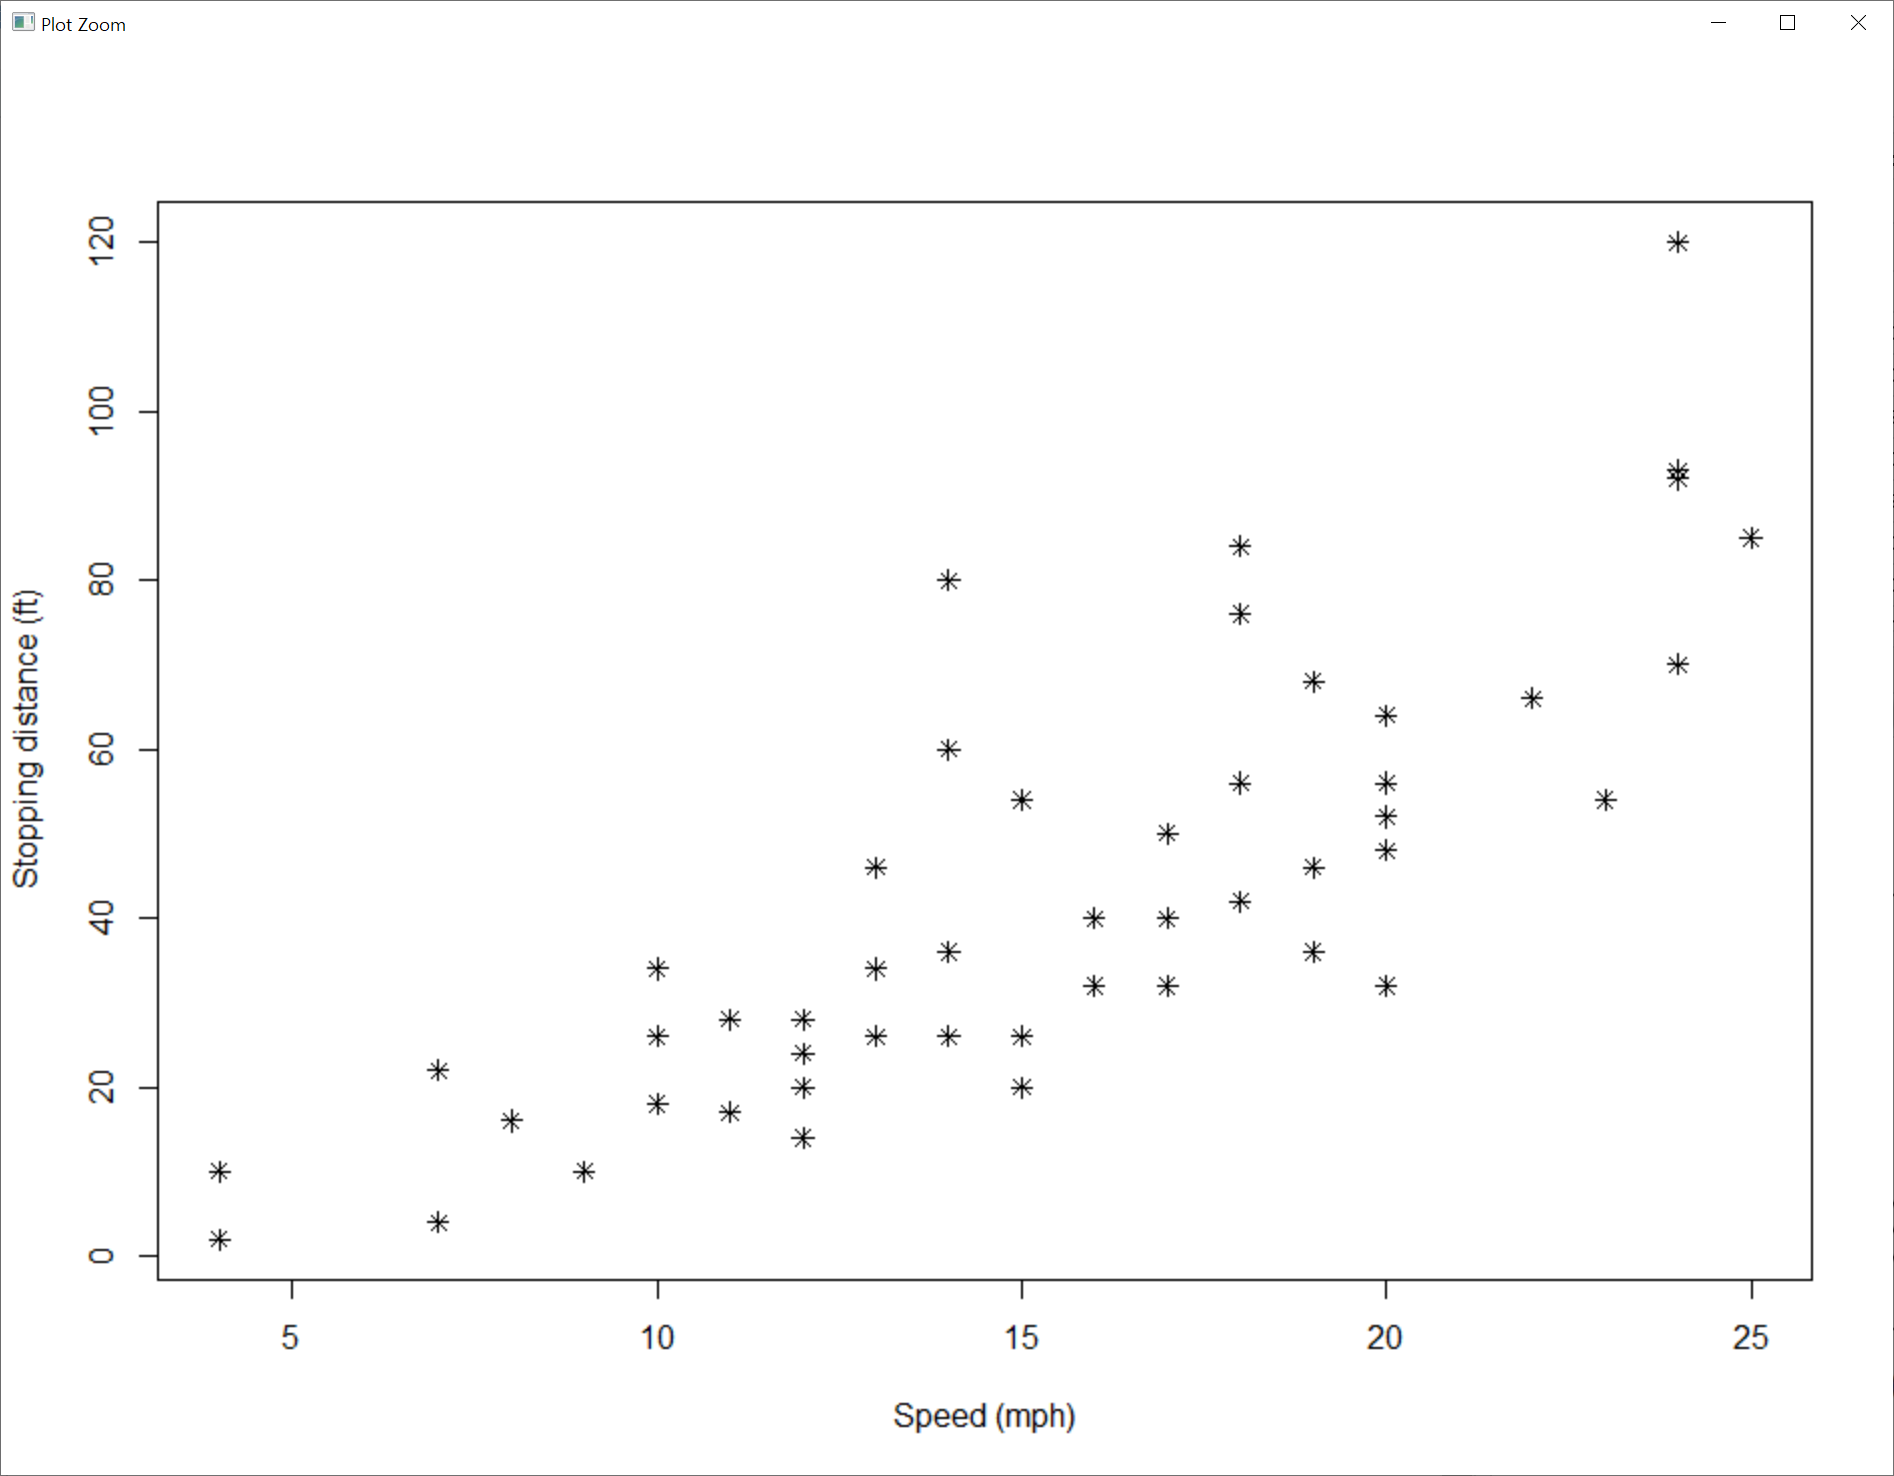
> plot(dist ~ speed, xlab ="Speed (mph)", ylab ="Stopping distance (ft)",
+ pch="*", cars)

> # col(색깔) 25가지, pch(모양) 25가지, cex(크기)=2를 합친 예제
> plot(1:25, 1:25, col=1:25, pch=1:25, cex=2)

'데이터 [Data] > R' 카테고리의 다른 글
| R Graphics 3: 문자나 점의 크기, 그래픽모수, 플랏영역, 좌표축범위 (0) | 2021.06.03 |
|---|---|
| R Graphics 2: 그래프유형, 색상, 낮은 수준의 그래프함수 (0) | 2021.06.02 |
| R apply 함수군: apply(), lapply(), sapply(), tapply(), mapply() (0) | 2021.05.01 |
| R 제어문: 조건문, 반복문 (0) | 2021.04.30 |
| R 데이터 가공: 결측값 처리, 그룹별 요약통계량 계산, 변환 (0) | 2021.04.29 |


댓글